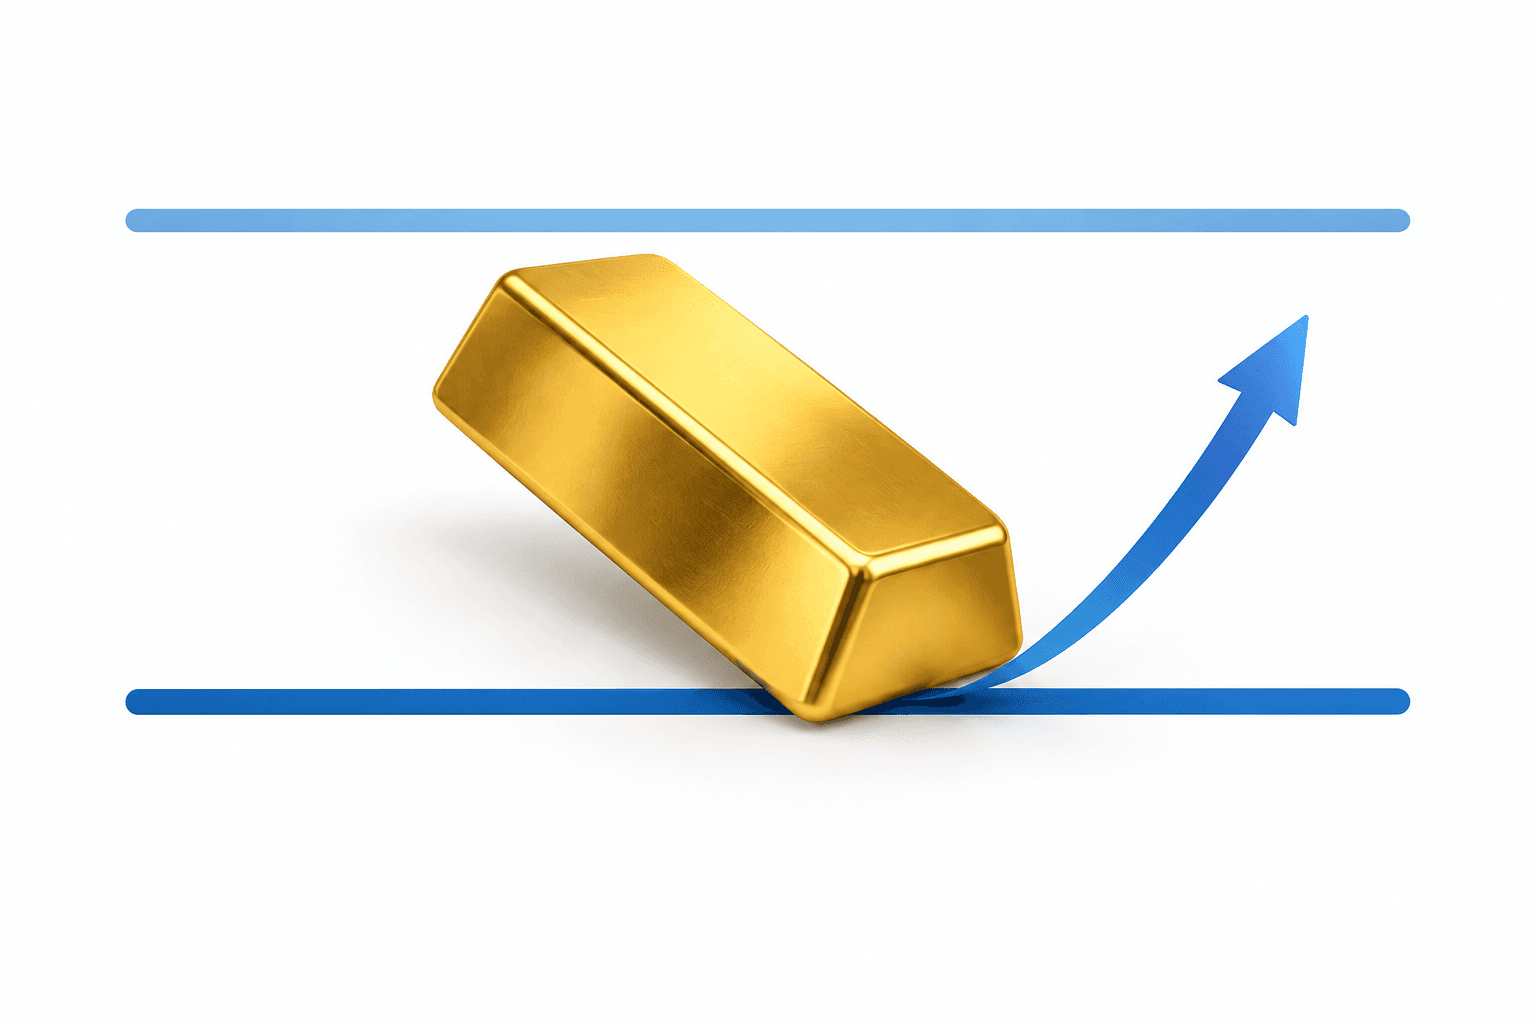
Gold price movement reversed upward from the 4,000 support zone, according to a technical assessment published on October 27, 2026. The assessment identified 4,100 as the next resistance level.
Gold price support zone
The reversal occurred in a zone that included the 4,000 level, a trendline marking the lower boundary of a daily downward channel, and the lower daily Bollinger Band.
The 4,000 level had previously reversed the price since June, while the downward channel dated from September.
Resistance above the reversal
The assessment identified 4,100 as a resistance level. It had served as support at the start of October.
The assessment also described the daily candlestick at the reversal as a bullish doji. These chart observations do not establish that gold will reach the resistance level.
Read More News
Disclaimer
This FinanceVelix article provides general information, not personalized financial, investment, legal, or tax advice. Market prices, interest rates and economic conditions can change; investments carry a risk of loss. Facts reflect the material available when published and may change. Check important information independently and consult a qualified professional when needed. Mentioning an asset, company, or service is not an endorsement.




Comments
Be respectful. No spam, impersonation or private credentials. Ordinary posts and comments appear immediately; suspicious links are held for review.
Please wait…