Southwest earnings for the third quarter of 2026 are scheduled for release on October 21. As of October 16, analysts expected adjusted earnings of $0.57 per share on revenue of $8.24 billion, with the focus on whether strong projected unit-revenue growth could offset fuel and other operating costs.
Key Takeaways
- The analyst adjusted-EPS estimate of $0.57 sits within management’s $0.50–$0.75 guidance range.
- Southwest projected unit-revenue growth of 17.5%–19.5% despite flat to slightly lower capacity.
- Fuel-price assumptions and rising non-fuel unit costs are key benchmarks for the results.
Table of Contents
- Southwest earnings expectations face downward revisions
- July guidance sets the operating benchmarks
- Costs will shape the revenue-to-profit outcome
- Conclusion
Southwest earnings expectations face downward revisions
Analysts had made 16 downward revisions to third-quarter earnings-per-share estimates over the preceding three months. The $0.57 adjusted-EPS forecast remained within Southwest’s guidance range, but below its midpoint.
The analyst revenue and earnings estimates are pre-release expectations, not reported results or company guidance. The October 21 announcement will establish how the airline performed against those benchmarks.
| Item | Details |
|---|---|
| Third-quarter capacity guidance | Available seat miles down 1% to flat year over year. |
| Third-quarter fuel assumption | $3.70–$3.75 per gallon, based on the July 17, 2026, forward curve. |
| Third-quarter non-fuel unit-cost guidance | Up 3.5%–4.0% year over year, excluding fuel, special items and profit sharing. |
July guidance sets the operating benchmarks
Southwest’s third-quarter guidance, issued with its July 22 second-quarter results, projected adjusted EPS of $0.50–$0.75 and full-year adjusted EPS of $3.25–$4.25. The annual range replaced an earlier expectation of at least $4.00; it was not a comparison with completed full-year results.
Management expected operating revenue per available seat mile, or unit revenue, to increase 17.5%–19.5% year over year. With capacity forecast to be flat or slightly lower, that outlook pointed to more revenue per unit of flying rather than expansion as the main projected sales driver.
The guidance assumed that the fare environment and demand trends would remain broadly intact. Its fuel-cost estimate used the forward fuel curve as of July 17, making it an assumption rather than a confirmed quarterly expense.
Costs will shape the revenue-to-profit outcome
Southwest also expected higher non-fuel costs per available seat mile. Its forecast included a 1.1-percentage-point headwind from removing six seats from Boeing 737-700 aircraft to enable extra-legroom seating.
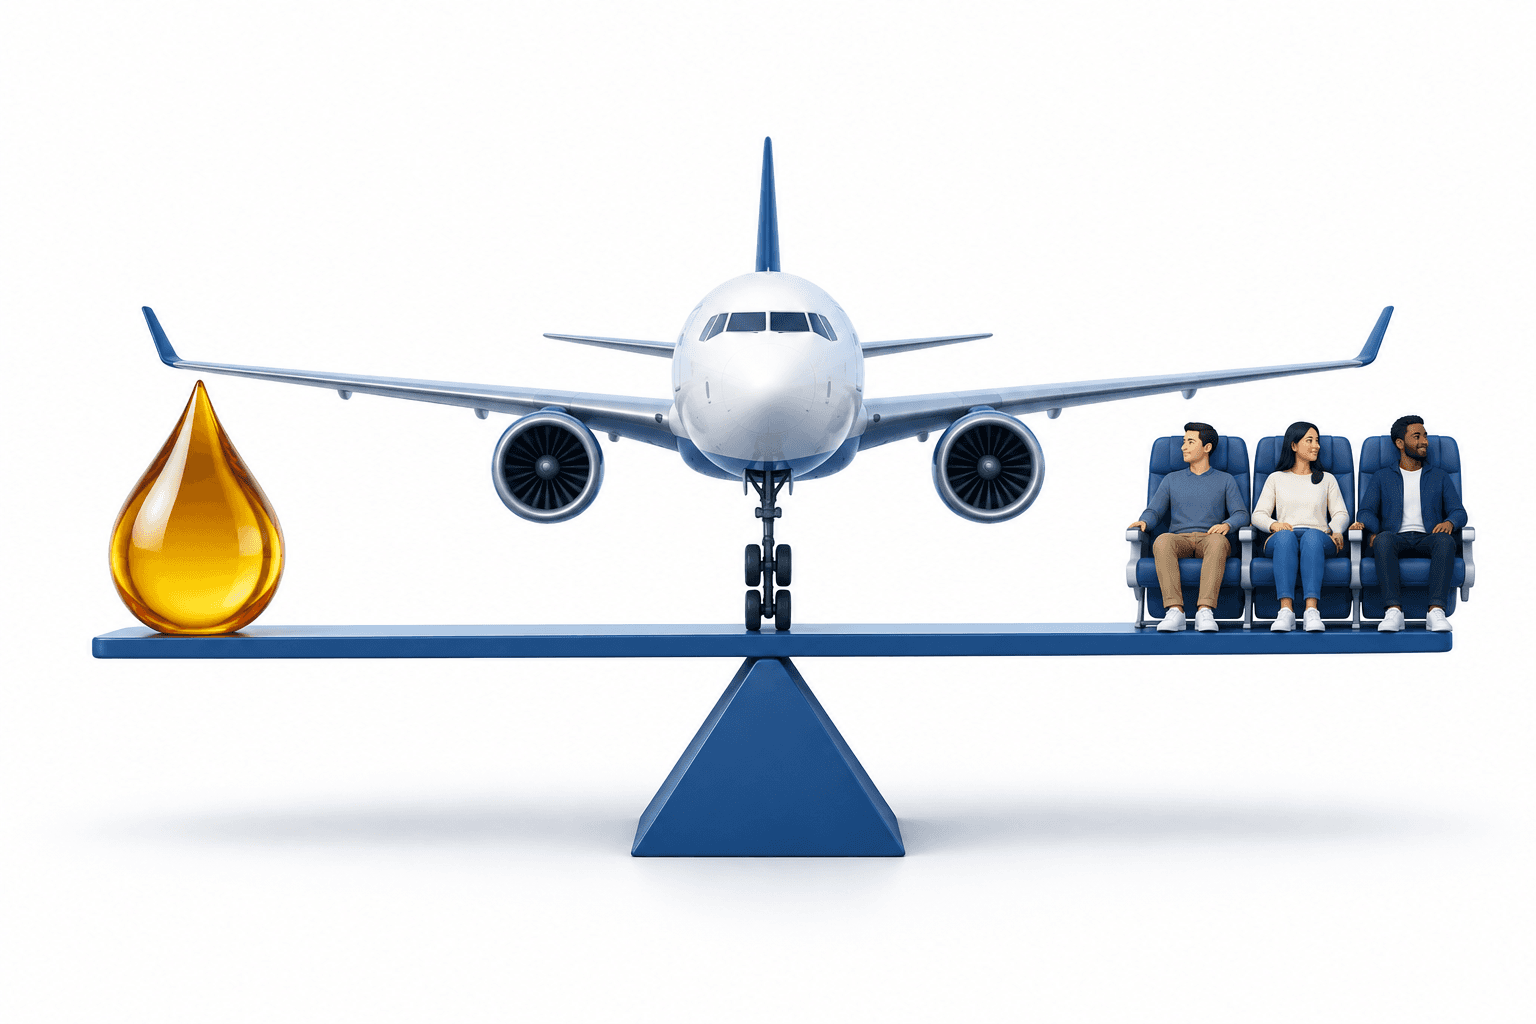
The results therefore need to be read across both revenue and expense measures. Stronger unit revenue alone would not establish that profitability improved if fuel or other costs exceeded the assumptions underpinning guidance.
Conclusion
The October 21 results are the next scheduled checkpoint for comparing Southwest’s earnings, unit revenue and fuel costs with its pre-release expectations and July guidance.
Read More News
Disclaimer
This FinanceVelix article provides general information, not personalized financial, investment, legal, or tax advice. Market prices, interest rates and economic conditions can change; investments carry a risk of loss. Facts reflect the material available when published and may change. Check important information independently and consult a qualified professional when needed. Mentioning an asset, company, or service is not an endorsement.