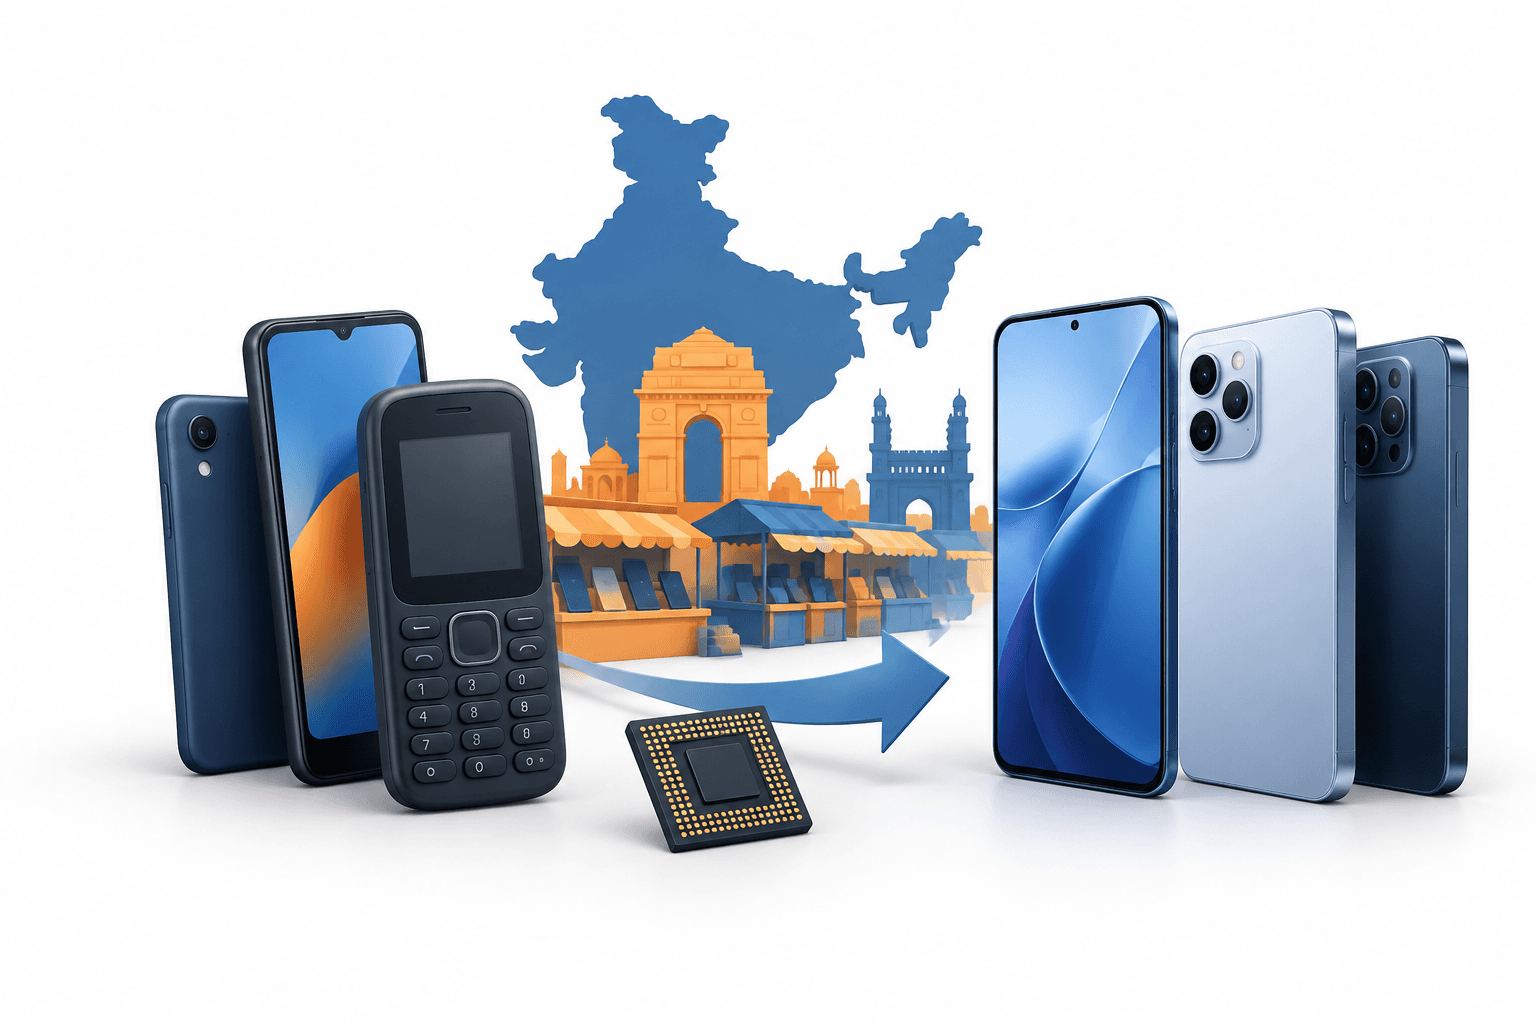
Chinese smartphone brands accounted for 67–68% of India’s smartphone market in July–September 2026, as rising memory-chip costs prompted manufacturers to reduce budget offerings. Domestic brands gained ground among price-sensitive buyers, even as the overall market contracted sharply ahead of Diwali.
Key Takeaways
- Omdia put Chinese brands’ share at 68%, while Counterpoint Research estimated 67%.
- Indian brands increased their combined share to 7%, led largely by Ai+ and Lava.
- Higher component costs are pushing manufacturers toward pricier models while consumers delay upgrades.
Table of Contents
- Chinese smartphone brands retreat from budget models
- Domestic brands gain in a shrinking market
- Distribution and service will test the gains
- Conclusion
Chinese smartphone brands retreat from budget models
Omdia’s estimate puts Chinese brands’ market share down three percentage points from April–June and seven points from a year earlier. Counterpoint Research said its 67% estimate was the lowest since the first quarter of 2019.
Manufacturers including Vivo, Oppo and Xiaomi have reduced lower-priced model offerings as memory costs squeeze already thin margins. Omdia principal analyst Sanyam Chaurasia said manufacturers had spent the past four to five quarters cutting specifications to manage costs, while prioritising mid-range and premium devices to support profitability.
Counterpoint Research’s analysis of India’s affordable smartphone market explains how rising memory and component costs make the lower end of the market harder to serve. That pressure helps explain why demand for inexpensive phones can remain available even as established suppliers narrow their ranges.
| Item | Details |
|---|---|
| Chinese-brand share, April–June 2026 | 71%, Omdia estimate |
| Chinese-brand share, July–September 2025 | 75%, Omdia estimate |
| Chinese-brand historical peak | 80% in April–June 2020, Omdia estimate |
| Ai+ shipment growth | More than fourfold year on year in July–September 2026 |
| Smaller domestic brands’ shipment scale | Around 300,000–500,000 units per quarter, Omdia estimate |
Domestic brands gain in a shrinking market
Indian brands’ combined market share rose from 2% a year earlier to 7% in the quarter ended September 30, according to Counterpoint Research. That was their highest share since October–December 2018.
Counterpoint research director Tarun Pathak said Ai+ and Lava accounted for almost 95% of Indian brands’ contribution. New entrants Mivi and Boltt also joined the market during the quarter.
The gains came against a weak industry backdrop. Estimates from Counterpoint and Omdia put the year-on-year shipment decline at 20–26%, with shipments reaching a decade-low 35.8 million units. Higher device prices and delayed upgrades weighed on demand ahead of the usual Diwali shopping boost.
The shift therefore represents a redistribution of a smaller market, rather than evidence of a broad recovery in smartphone demand. Apple and Samsung also gained share as their premium offerings left them better positioned than budget-focused competitors, analysts said.
Distribution and service will test the gains
Maintaining inexpensive product line-ups has given domestic manufacturers an opening, but analysts cautioned that competitors’ retreat alone would not sustain growth.
Chaurasia said expansion would require stronger distribution, reliable inventory, after-sales infrastructure and workable channel economics. Pathak highlighted investment in research and development, product quality and scalable customer service, alongside deeper localisation of the value chain.
Those requirements make customer retention an important test: winning a first purchase on price is different from building a business capable of supplying and supporting customers at greater scale.
Conclusion
The Diwali buying period is the next test for Indian brands’ expanded presence. The key question is whether they can turn the opening left by Chinese smartphone brands into sustained sales while maintaining product quality, availability and service.
Read More News
Disclaimer
This FinanceVelix article provides general information, not personalized financial, investment, legal, or tax advice. Market prices, interest rates and economic conditions can change; investments carry a risk of loss. Facts reflect the material available when published and may change. Check important information independently and consult a qualified professional when needed. Mentioning an asset, company, or service is not an endorsement.